"Wetter than you may think!"
 |
Flood History
"Wetter than you may think!" |
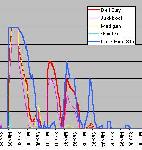
Click on the thumbprint above to see a graph of Lake floods and water source compiled from satellite images from September 1979 and measured depths from 1973-1978 that may illustrate the 25-35 year flood cycle. See below for an explanation of both graphs.
Most Flood Level Reports are Wildly Innaccurate
Lake Eyre has some water in it more often than many would lead you to believe. When Halligan flew over the Lake in the 1920's and reported it as being about one third full he was ridiculed by seasoned explorers.
Today we have similar situations where land based observers can't believe the dry Lake they are looking at contains water and airborne observers are claiming that the "Lake is the fullest it's been in years". Quite often they are both wrong!
Why:
Reliable Information From Satellite Images
In the early days the Commodore was faced with the difficulty of deciding if the 3000km round trip would result in a successfull sailing adventure. Phone calls to locals, rangers, policemen, publicans and pilots gave wildly conflicting reports. Their report was based on limited personal observation and heresay - a more reliable method was required.
Landsat satellite images available from the Auslig web site http://www.auslig.gov.au were proven to be the most reliable way of determining these parameters. Of course the images were first "calibrated" using published depth diagrams checked by actual depth measurements on sailing trips. Experience has shown depths can be estimated within 100mm in the navigation critical 1 to 3metre depth range.
With experience water proximity to certain features in the Lake can quickly indicate depth.
The colour of an area on the image provides the information required:
| White | The highly reflective surface of a dry salt crust |
| Brown | Dry mud on the Lake edge |
| Red Browns | Algae living in wet mud |
| Pale Blue | Wet salt crust |
| Mid Blue | Shallow water (<50mm) |
| Dark Blue | Deeper Salty Still Water mostly navigable (>450mm) |
| Blue-Green | Turbid fresh water containing algae |
| Red | Fresh vegetation growing in creek beds |
| Green | Established vegetation growing on dunes |
| Blue/Purple-Black | Dead vegetation in creek beds |
| Browns and Oranges on land | Arid landscape |
| Darker Browns and Blacks on land | Rocky hills or Gibber desert |
| Lighter browns and yellows | Dunefields |
Recent local rain, however, can make the whole Lake appear dark and give a misleading indication of depth.
A more accurate reading can only be made when the Lake is either white(or light blue) salt where dry and dark blue where the depth is greater than 50mm.
Consideration must also be given to wind direction and strength which is discussed in the yachting guide.
Scoping the rivers - typical floods
These are "back of an envelope calculations" only!
Warburton flood
In a typical Warburton flood 10 cubic kilometres of water crosses the Queensland/Souith Australia border.
At the Cowarie/Kalamurina boundary The Warburton is typically 50m wide x 7m deep
flowing at 5km/hr = 1,750,000 cubic m/hour = 1.75glt/hr = 42gl/day = 3.78
cubic kilometres over 3 months
Cooper Flood (at Birdsville Punt)
200m wide x 4m deep flowing at 3km/hr = 2,400,000 cubic m/hr = 2.4glt/hr = 57.6 gl/day = 5.184 cubic kilometres over three months
The Murray
Averages 3-10gl/day but in flood can exceed 100gl/day.